Using the SQL Monitor
SQL Monitor
The new SQL Monitor is a new development with SAP NetWeaver 7.40.
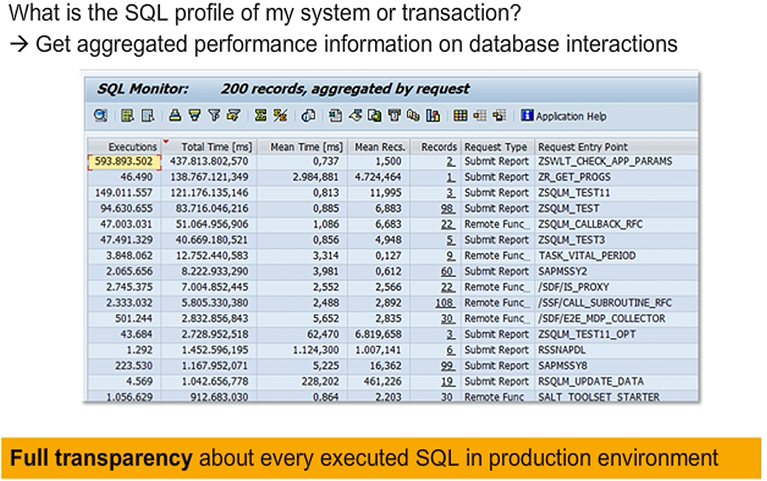
It is a powerful tool for capturing the SQL profile of a system or transaction. SQL profile refers to aggregated data about all SQL requests executed in the context of a certain business process, application, and so on. This includes how often each request is executed, which tables are accessed, the total runtime, how many records are fetched, and more.
The New ABAP SQL Monitor – Architecture
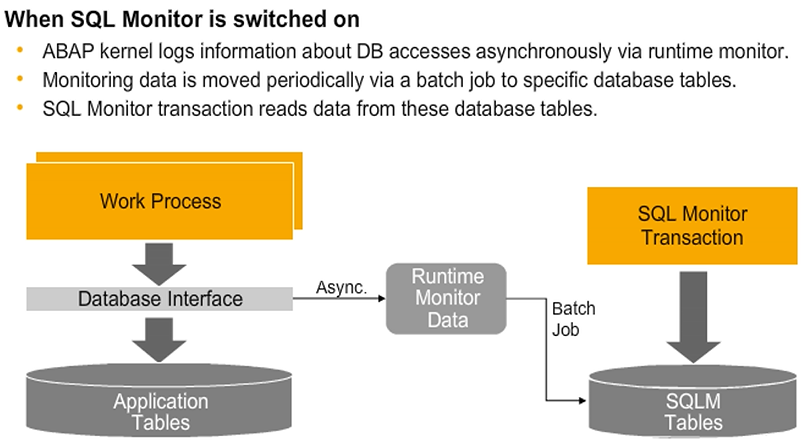
A central design goal was to ensure that the SQL Monitor can run in the productive environment because this is where the real SQL profile of an application can be observed. The SQL Monitor introduces only a minimal performance overhead and all data collection is done asynchronously without additional database interaction affecting the runtime of the actual business processes.
When the SQL Monitor is enabled, the ABAP kernel logs information about database accesses (for example, transaction, source code position, accessed tables, and so on) using the runtime monitor infrastructure (file based). This data is transferred periodically to the SQL Monitor database tables (every 24 hours, with manual refresh possible). The transfer is required for data analysis and in order to store the results permanently.
The SQL Monitor provides a dedicated transaction for displaying and analyzing the data, which in turn reads from the respective database tables containing the collected data.
Switching the SQL Monitor on and Viewing SQL Monitor Data
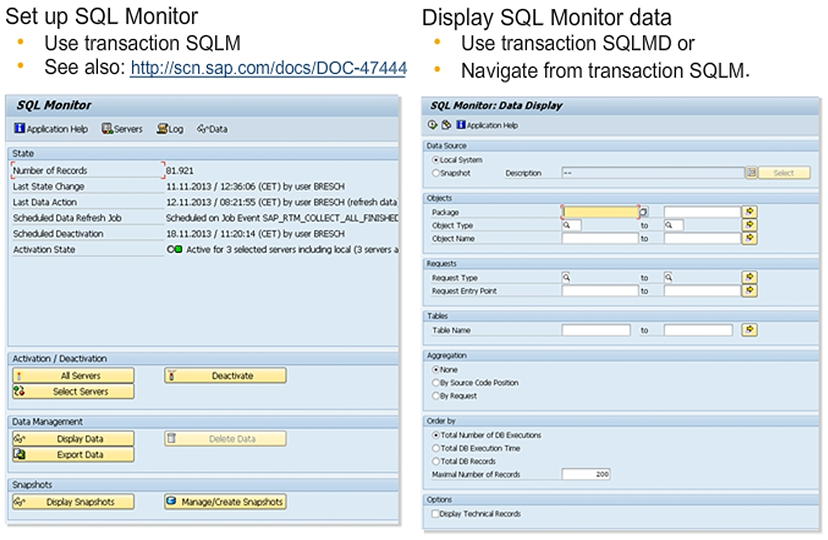
After the initial setup of the SQL Monitor, you can activate or deactivate the monitor via transaction SQLM. When you launch it, it displays the current status. You can activate it for all application servers or for specific application servers. You can also specify an expiration date and an upper limit for the number of records.
After data has been collected, you can view the collected SQL profile either by navigating from transaction SQLM or by launching transaction SQLMD.
You can specify a number of filter criteria. For instance, you can filter by development objects, such as package, object type and name, or by request (transaction <XY> , or Web Dynpro Application <ABC>) and respective request type (for example, URL, RFC, report). You can also define a filter for looking into accesses to specific database tables.
You can select a certain aggregation type and a sorting of the result list.
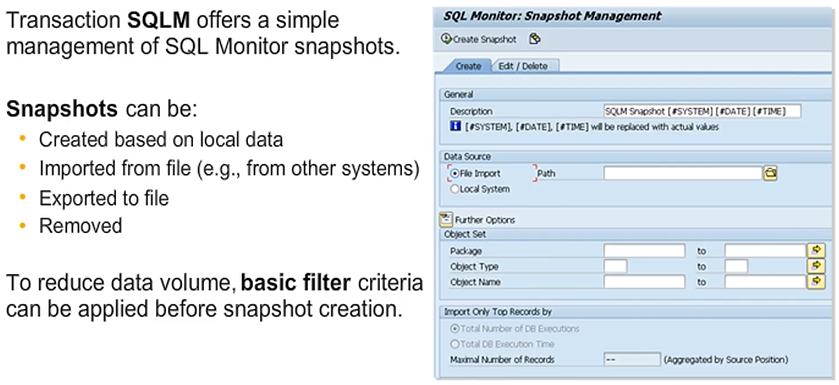
Exporting and Importing SQL Monitor Snapshots
As the SQL Monitor should collect data in a productive system, and the code optimizations are usually planned in another system, such as a development system or sandbox environment, it is desirable to be able to export and import the collected data. The SQL Monitor supports exporting and importing snapshot data for this purpose. These tasks can also be performed using the SQLM transaction.
Note: The exported data can also be analyzed via other tools, such as a SAP Lumira, allowing nice visualizations and more complex analytical operations.